Unlocking the Secrets of AC Circuits: A Journey into Phasor Diagrams
Ever feel like the alternating current in your circuits has a secret life? Like there’s a hidden rhythm, a pulsating dance happening beneath the surface? Well, there is. And understanding it is like finding the key to a hidden world of electrical elegance. That key is the phasor diagram, a visual representation that transforms the complexity of AC circuits into an understandable, almost intuitive, form.
Phasor diagrams for AC circuits provide a snapshot of how voltage and current relate to each other in time. Instead of grappling with sinusoidal waves that shift and oscillate, we can use these diagrams to “freeze” the action, revealing the interplay of these electrical quantities. Imagine capturing the intricate choreography of a dance in a single, revealing photograph – that’s the power of a phasor diagram.
The concept of representing sinusoidal functions with rotating vectors, the foundation of phasor diagrams, emerged from the mathematical work of Charles Proteus Steinmetz in the late 19th century. His insights revolutionized AC circuit analysis, providing a powerful tool for engineers to design and analyze the increasingly complex power systems of the era. Without phasor diagrams, the modern electrical grid, and the technologies it powers, would be unimaginable.
The core issue phasor diagrams address is the phase relationship between voltage and current in AC circuits containing reactive components like inductors and capacitors. These components cause the current and voltage to peak at different times, a phenomenon known as phase shift. Trying to analyze these shifts using traditional time-domain methods can be cumbersome. Phasor diagrams offer an elegant solution, representing these phase shifts as angular differences between rotating vectors.
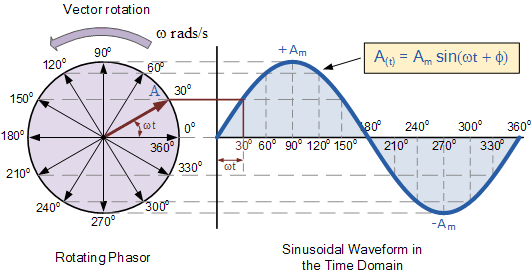
A phasor is a rotating vector representing a sinusoidal quantity like voltage or current. Its length corresponds to the amplitude of the sinusoid, and its angle represents its phase relative to a reference. For example, in a purely resistive circuit, the voltage and current phasors are aligned, indicating they are in phase. However, in a circuit with an inductor, the current phasor lags the voltage phasor, visually depicting the current's delayed response to changes in voltage.
One major benefit of phasor diagrams is their ability to simplify complex circuit calculations. By representing AC quantities as vectors, we can use vector addition and subtraction to analyze circuits with multiple components, avoiding complex trigonometric calculations. This graphical approach allows for quicker and more intuitive problem-solving.
Another advantage lies in visualizing resonance. In resonant circuits, specific frequencies cause the voltage and current phasors to align, maximizing energy transfer. Phasor diagrams clearly illustrate this alignment, making it easier to understand and predict resonant behavior.
Furthermore, phasor diagrams are indispensable for analyzing three-phase systems, the backbone of power distribution. They allow engineers to visualize the phase relationships between the three voltages and currents, crucial for balancing loads and ensuring efficient power delivery.
To construct a phasor diagram, identify the reference phasor, usually the source voltage. Then, represent each voltage and current as a rotating vector, with its length representing the amplitude and its angle representing the phase shift relative to the reference. The resulting diagram provides a visual representation of the circuit's behavior.
Advantages and Disadvantages of Phasor Diagrams
| Advantages | Disadvantages |
|---|---|
| Simplifies AC circuit analysis | Primarily applies to steady-state sinusoidal conditions |
| Visualizes phase relationships | Can become complex for highly intricate circuits |
| Facilitates calculations in complex circuits | Doesn't directly represent transient behavior |
Best practices include choosing a consistent reference phasor, accurately representing magnitudes and angles, clearly labeling phasors, and using appropriate scaling to ensure clarity.
Frequently Asked Questions:
1. What is a phasor? (A rotating vector representing a sinusoidal quantity.)
2. Why are phasor diagrams useful? (They simplify AC circuit analysis.)
3. How do you construct a phasor diagram? (Represent voltages and currents as rotating vectors with appropriate magnitudes and angles.)
4. What is phase shift? (The time difference between the peaks of voltage and current.)
5. How do phasor diagrams represent phase shift? (As the angular difference between phasors.)
6. What are the limitations of phasor diagrams? (They primarily apply to steady-state sinusoidal conditions.)
7. How are phasor diagrams used in three-phase systems? (To visualize the phase relationships between voltages and currents.)
8. How can I learn more about phasor diagrams? (Consult textbooks on circuit analysis or online resources.)
Tips and tricks: Use software tools for complex phasor diagrams. Practice drawing phasor diagrams for various circuit configurations. Relate phasor diagrams to real-world applications to deepen understanding.
In conclusion, phasor diagrams are invaluable tools for anyone working with AC circuits. They transform complex sinusoidal relationships into visually intuitive representations, simplifying analysis and design. From understanding basic circuit behavior to analyzing intricate power systems, mastering phasor diagrams unlocks a deeper understanding of the electrical world. Embrace the power of the phasor, and navigate the rhythmic dance of alternating current with confidence and clarity. By using phasor diagrams, we can simplify AC circuit analysis, visualize phase relationships, and facilitate calculations in complex circuits. This powerful tool allows us to gain deeper insights into the behavior of AC circuits and design more efficient electrical systems. So, explore the world of phasor diagrams and unlock the secrets of AC circuit analysis.
Can i run it black desert online find out before you download
Unveiling the impact of dr lim lee guan
Is the 48l vortec engine reliable a comprehensive guide


